


Through a bit of data exploration and analysis, you can determine which variables hold the most weight over different periods of time. Using weighted averages over time in Dataiku, we will try to answer a common argument: Are NBA players, specifically LeBron James, more focused in the playoffs in comparison to the regular season?
Data description and cleaning
Game statistics at the end of each quarter (a game has four quarters) can be found on the website statmuse.com. There are other data sources such as basketballreference.com and nba.com but those sources only provide end-of-game statistics. Since we are trying to measure intensity level, looking at quarterly data is a better reflection because it can measure more closely things like momentum shifts, substitution patterns, in-game adjustments, fatigue, and sense of urgency. The statistics we will use in our analysis are points, assists, rebounds, steals, blocks, turnovers, and plus/minus (which calculates point differential and their own statistical impact when the player is on the court). The data is split into two datasets: regular season and playoffs. The playoff data consists of LeBron playing three games a week. For a fair comparison, we use an “if-then” statement in Dataiku and only the dataset for games where LeBron James was playing three games a week in the regular season.
Data analysis through weighted averages
Instead of just measuring basic statistics like sum, averages of points, or assists, we wanted a more complete scope of what we will call “effort level”. I created two weighted averages to accomplish this. In the context of basketball statistics, weighted averages can be applied to account for the player's impact on the court. The two weighted averages I created are interpreted as followed:
Offensive efficiency
Offensive Efficiency is heavily weighted on scoring. The variables that carry the most weight are points and a variable called shot efficiency, which calculates field goals made against field goal attempts with three-pointers carrying twice the weight. An additional weight is turnovers which are doubled and go against offensive performance (shot efficiency, points, and assists).
Offensive Efficiency = ((Shot Efficiency + Points + Assists) - Turnovers x 2 + Plus/Minus ) ÷ Minutes Per Quarter
*Shot Efficiency = (Field Goals + (3 Pointers x 2)) + ((Field Goals - Attempts) + ((3 Pointers - 3 Attempts) x 2 ))
Hustle efficiency
Hustle Efficiency factors in how the player can impact the game outside of points and assists. Rebounds, steals, and blocks are all equally weighted.
Hustle Efficiency = (Rebounds + Steals + Blocks + Plus/Minus) ÷ Minutes Per Quarter
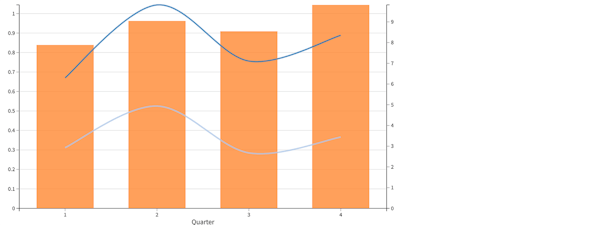
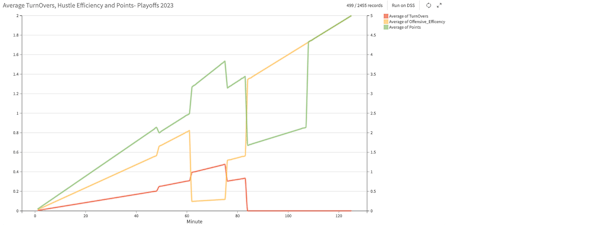
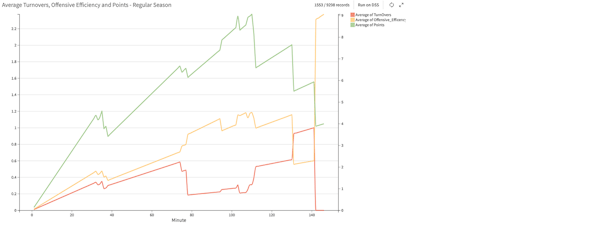
The weighted averages will be broken down on a per-quarter basis and a per-minute basis. The data is already set up for quarterly analysis however, the per-minute sequences are a bit more complicated. In Dataiku, we used a Python recipe to accomplish this by calculating the incremental increase in points based on the average points per minute. This is over the total minutes played in a three-game period per week which is around 120-130 minutes played. For example, say LeBron James has nine points for eight minutes played in a quarter which is an average of 1.125 points per minute. It then provides the cumulative value over an eight-minute period: